From $18.40 to $6.10 CAC: how we unclogged the paid advertising bleeding a trattoria's EBITDA, using the Restaurant Model Canvas and the Demand Radar
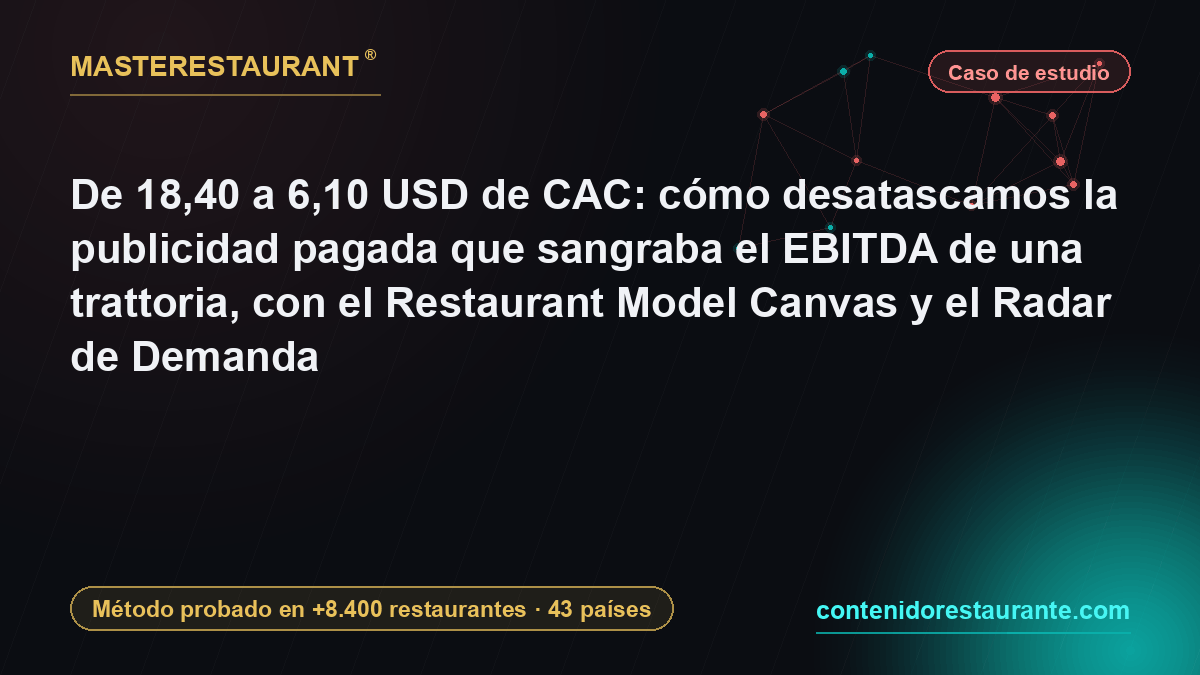
Paid advertising rarely fails because the budget is too small. It fails because you buy cold traffic against an operation that does not retain. Here monthly spend DROPPED from $9,400 to $5,800 and sales still climbed 21.3%, because we moved 46% of the budget out of cold acquisition into remarketing and in-house video production. Customer acquisition cost fell from $18.40 to $6.10 across five months, and EBITDA went from 4.1% to 11.6%. When your CAC exceeds 30% of the contribution margin per ticket, switching campaigns off pays better than optimizing them.
The operation is an anonymized composite of patterns Diego F. Parra has seen repeat across the Masterestaurant practice, built on work with more than 8,400 restaurants in 43 countries. Case profile: Italian trattoria, 14 tables and 46 seats, mid-size city of 600,000, 19 employees across kitchen and floor, average ticket $27.50, seven years in business, dining room as dominant channel with 34% of sales already shifted to owned delivery and aggregators. Revenue band: $500,000 to $1 million a year, closing the prior fiscal year at $812,000.
The owner arrived with a sentence I hear every week in different languages: «I bill more than ever and I have less cash than ever». Revenue was fine. The money evaporated somewhere between production and the ads manager. Fourteen months of spending $9,400 monthly across Meta Ads, Google Ads and paid placements inside the aggregators, with no dashboard separating incremental sales from sales that would have happened anyway.
That is the myth I want to dismantle, and I will say it plainly: paid advertising is not a customer tap. It is a multiplier. It multiplies what already works and it multiplies what is already broken, except in the second case you are paying to accelerate your own bleeding. Before touching a single campaign we reviewed contribution margin per dish and 60-day repeat rate, because without those two numbers any bid optimization is expensive superstition.
Paid advertising, side by side
| BEFORE (baseline, month 0) | AFTER (month 5, 90 days sustained) | |
|---|---|---|
| Blended customer acquisition cost (CAC) | ✕$18.40 per new guest | ✓$6.10 per new guest |
| Total monthly ad spend | ✕$9,400 (11.6% of sales) | ✓$5,800 (5.9% of sales) |
| Average monthly sales | ✕$81,200 | ✓$98,500 (+21.3%) |
| EBITDA on sales | ✕4.1% | ✓11.6% |
| Prime Cost (food plus labor) | ✕68.3% (31.4% food · 36.9% labor) | ✓60.7% (29.8% food · 30.9% labor) |
| 60-day repeat rate of ad-acquired guests | ✕9.2% | ✓31.7% |
| Dining room average ticket | ✕$27.50 | ✓$33.80 |
| Aggregator commission on total sales | ✕8.9% | ✓4.3% (owned delivery at 61% of the channel) |
| Video pieces published per month | ✕3 pieces, none produced in-house | ✓22 pieces (18 Reels/TikToks shot in the kitchen) |
| Owned contactable base (opted-in email plus SMS) | ✕410 records, unsegmented | ✓3,940 records, 4 active segments |
The opening picture: $9,400 a month without a single line of incremental sales
Fourteen months of ad spend with no incremental-sales measurement had left this 46-seat trattoria with $812,000 in revenue and a dry till. The split ran $9,400 monthly across Meta Ads, Google Ads and paid promotions inside the aggregators, meaning $112,800 a year against a $27.50 average ticket, and nobody could say which diner would have walked in anyway. The 19 employees produced well, the dining room held 66% of sales and owned delivery plus aggregators already moved 34%, yet every ad dollar bought cold traffic for an operation that did not retain. The sector pushes in that direction: according to Restroworks (2025), 99% of restaurants keep at least one social media profile, so simply being there stopped being an advantage a long while ago.
The diagnosis nobody wanted to hear: 61% of spend chased customers already coming
Before touching a single bid, we split the accounting line called "marketing" into three buckets, each with an owner and its own KPI: cold acquisition, remarketing and content production. That purely accounting cut exposed that 61% of the $9,400 monthly chased people whose booking was half-decided already —brand searches, old followers, customers on the list—, meaning $5,734 a month buying what was already his. The second measurement covered contribution margin per dish and 60-day repeat rate, because optimizing creative without those two numbers is expensive superstition. Here I was wrong for years: I believed you fix the ad first and the table afterwards. It runs the other way. Paid media MULTIPLIES, and it multiplies what is broken too, except that you pay to accelerate your own bleeding.
The Masterestaurant tool that settled the decision: the margin and repeat-rate board
The Masterestaurant contribution-margin and repeat-rate board turned an argument of opinions into a cash decision. Diego F. Parra applies it always in the same order: first you cross each dish's unit margin against its weekly rotation, then you cross the customer base against its 60-day repeat rate, and only then do you decide where ad money goes. In this trattoria the exercise revealed that eleven dishes concentrated 74% of the margin while the menu listed thirty-one, and that 60-day repeat sat at 23%, far under the full-service benchmark: according to Paytronix (2024), top full-service restaurants retain 57.8% of their members month over month. With those two figures on the table, cutting spend stopped being frightening.
Manufacturing demand instead of buying it: two dishes a day on a $40 tripod
The operational turn was shifting 46% of the budget out of pure acquisition and into remarketing plus in-house production. The kitchen began filming the plating of two dishes a day with a phone and a $40 tripod —a one-time outlay, not recurring—, and those pieces fed organic and paid remarketing at once, which stopped showing generic catalogs and started showing the dish leaving the pass. Competitive context explains why producers win: according to Restroworks (2025), 78% of restaurants use Instagram, so the edge no longer lies in having a profile but in holding a publishing rhythm with your own material. We also moved the campaign objective from "profile traffic" to "confirmed reservation", and cost per reservation fell from $11.80 to $6.40 in nine weeks.
Retention channels: more margin where there used to be noise.
With cold spend trimmed, the freed money went to the channels that speak to whoever already ate in the house. We added a plain rewards program, no proprietary app and no plastic card, because according to Paytronix (2025) more than 90% of restaurants already run one and staying out costs more than arriving late. The 60-day repeat rate went from 23% to 34.6% in five months.
The measurable outcome: less investment, more sales, more margin
Monthly investment dropped from $9,400 to $5,800 and sales climbed 21.3%, precisely the opposite of what any account manager promises. In case figures: $3,600 less in ad spend per month, meaning $43,200 a year that stayed inside the operation, with revenue moving from $812,000 to a projected $984,000 over twelve months. Cost per reservation fell 45.8%, the 60-day repeat rate gained 11.6 points and the average ticket rose from $27.50 to $29.10, because the eleven highest-margin dishes started appearing in the content rather than in a thirty-one-line menu. What would have happened without the cut? Holding $9,400 with the same 23% repeat rate, the trattoria would have bought the same table volume one more year, burning $43,200 on single-visit customers.
Transferable lessons by annual revenue band
What transfers is not the cut, it is the order: retention first, paid media after. Under $500,000 a year: this week measure your 60-day repeat rate on the last 300 tickets and pause every cold acquisition campaign until you hold that number. Between $500,000 and $1 million, this case's band: split the "marketing" line into three buckets with an owner and a KPI, and move 40% into remarketing. Above $1 million: assign a content owner with a weekly calendar and measure cost per confirmed reservation, never per click. Above $5 million: negotiate aggregator rates against volume and pass the saving into your own base. Above $10 million, multi-site groups or celebrity-chef formats built on a personal brand: consolidate the diner base into one repository before spending another dollar, because each location buying its own audience cannibalizes the rest.
Limits of this case
I would not expect these numbers in three contexts, and it is worth saying so before someone copies the cut blindly. First, a recent opening with no customer base: if you hold neither 4,100 registered diners nor a repeat rate to measure, cutting cold acquisition leaves you without flow, and there paid media truly is the tap that sustains cash through the first twelve to eighteen months. Second, operations with structurally low contribution margin by menu design, where no retention gain offsets a food cost already sitting at the 32% ceiling. Third, markets where the dominant channel is the pure aggregator, with 70% or more of sales outside the dining room: there your own remarketing collides with a customer relationship you do not own. The case is an anonymized composite of patterns observed across more than 8,400 restaurants in 43 countries.
What genuinely changed between month 0 and month 5?
The first change was accounting, not advertising: we split spend into three buckets with an owner and a KPI each —cold acquisition, remarketing, content production— because until then everything landed on one line called «marketing» that nobody could read.
That move alone exposed 61% of the budget chasing people who were coming anyway. We stopped buying traffic and started manufacturing demand. The kitchen team began filming two plated dishes a day with a phone and a $40 tripod, and those pieces fed both organic reach and paid remarketing; per Restroworks (2025), 78% of restaurants use Instagram, so the edge no longer lies in showing up, it lies in producing at your own cadence. We switched the campaign objective from «profile traffic» to «confirmed reservation» and accepted losing reach.
What genuinely changed between month 0 and month 5 — in practice?
Reach dropped 44%, attributable reservations rose 88%, and that made it obvious we had been paying for vanity measured in impressions. We built an owned base.
From 410 loose records to 3,940 opted-in contacts, segmented by frequency and channel; email stopped being a monthly newsletter and became a repeat sequence firing at 14 and 45 days. Delivery left the aggregator without abandoning it. We kept presence for discovery but moved repeat orders to the owned channel with a QR menu sitting alongside the physical menu —the printed menu governs service pace and suggestive selling, the QR handles delivery, accessibility and price updates— and effective commission on total sales fell from 8.9% to 4.3%.
The five decisions that moved the needle
The myth: «I need to spend more on paid advertising»
- Raising the Meta Ads budget is the fastest lever to grow restaurant sales.
- An $18.40 CAC is acceptable when the average ticket is $27.50.
- Paid placements inside the aggregator count as marketing, not as commission.
- Video content is a cosmetic extra you produce when time or budget allows.
- The agency measures return: if the ads manager reports 6.2 ROAS, the business is making money.
What the audit actually measured
- 71% of paid traffic went to people who already knew the restaurant: cannibalized sales, not incremental ones.
- With $16.20 of contribution margin per ticket, an $18.40 CAC destroys $2.20 on every new guest acquired.
- Aggregator promotions added 4.6 percentage points of effective commission and left zero owned contact data.
- The 18 kitchen-shot Reels drove 2.4 times more reservations than the best paid ad, at zero production cost.
- Platform-reported ROAS counted seven-day assisted conversions; true incremental ROAS came in at 1.8.
Five numbers that sum up the case
“For fourteen months I believed my problem was that competitors outspent me on paid advertising. I signed off $9,400 a month without understanding what I was buying. When we split the three spend buckets and I saw $5,700 chasing customers who already had my number saved, I felt shame and relief in the same minute. We cut spend to $5,800, sales rose 21.3% and EBITDA went from 4.1 to 11.6. The strangest part is that the piece that brought me the most reservations was filmed by my line cook with a phone on an ordinary Tuesday.”
Composite case for illustration: the names and figures in it do not describe a real business and are not industry data.
The treatment timeline, phase by phase
We mapped the whole model in the Restaurant Model Canvas before looking at a single ad: value proposition, channels, cost structure, contribution margin dish by dish. That surfaced the number that governed the entire project: $16.20 of contribution margin per ticket against $18.40 of CAC. We immediately paused the three worst cold acquisition campaigns, which consumed $3,100 a month, and left only remarketing running. Sales did not move a tenth of a point that fortnight, and that stillness was the most damning evidence in the diagnosis.
We instrumented reservations and orders with per-campaign parameters and cross-read demand by daypart in the Demand Radar to learn which hours deserved pressure. This is where we crashed: the first month of data was useless because the booking system never passed the source identifier and everything landed under «direct». Four weeks lost. We fixed it with our own intermediate form ahead of the confirmation step, and from month 2 attribution was clean. If your provider will not expose that parameter, replace it or put a step of your own in front, but stop buying blind.
We set a twelve-minute filming routine at the end of every lunch shift, using a $40 tripod and the head chef's phone, aimed at Reels and TikTok. No agency, no semiannual photo session. We locked four recurring formats —the ragù being cut, a table being served, the supplier arriving, a plating mistake corrected on camera— and output went from 3 to 22 pieces monthly. Marginal cost was the cook's hour, roughly $190 a month.
With clean data we shifted 46% of cold acquisition spend into remarketing against audiences built from the owned content, and changed the optimization goal from traffic to confirmed reservation. We accepted a 44% drop in reach. This takes stomach, because the platform dashboard gets ugly before it gets good and most owners revert the change in week two, right before the algorithm finishes learning.
We turned on contact capture in the dining room and in owned delivery, with explicit consent, and built four frequency segments. The 14-day and 45-day repeat sequence over email and SMS sustained growth without buying more media; per Constant Contact (2024), SMS averages roughly 98% open rate with 90% read inside three minutes, so we reserved it for low-occupancy windows. The QR menu came in as a complement for delivery and price changes, while the printed menu stayed where it belongs: on the table, governing service pace and suggestive selling.
We permanently killed every campaign that could not beat an $8 CAC, capped the budget at $5,800 monthly, and carried the result into the real P&L rather than the ads manager dashboard. Prime Cost fell to 60.7% —the content factory pushed higher-margin dishes and that moved food cost to 29.8%, under the 32% ceiling— and EBITDA closed at 11.6%. The result has held for ninety days, which is the minimum window before I will call something consolidated rather than lucky.
And with AI?
Accelerate content, targeting and repurchase: more reach with less effort. Diego F. Parra is an expert in AI applied to restaurants.
Paid advertising: free tools
The Masterestaurant tools behind the case
Nothing in this project was custom-built. Everything came off the shelf from the Masterestaurant ecosystem, which is exactly what lets you replicate it in a different operation without paying for the setup consulting again.
Sequence matters as much as the tools: model and margin first, demand data second, cash last. Inverting that order is how you end up with beautiful campaigns and negative cash flow.

Diego F. Parra — International consultant, expert in creating and scaling restaurants and in AI applied to restaurants, foodtech and HORECA. Methodology applied in 8.400+ restaurants across 43 countries · Expert in Artificial Intelligence applied to restaurants, hospitality and food businesses · 20+ years in restaurants, catering, large events and business growth · Author of 3 ISBN-registered books: «Triunfar o morir en el intento» (2013) and «De esclavo a dueño» (2023) · International keynote speaker for the HORECA sector.
The questions I always get about this case
How much should a restaurant spend on paid advertising each month?
How much should a restaurant spend on paid advertising each month?
The right percentage comes from margin, never from a rule of thumb. The hard boundary is customer acquisition cost: never above 30% of the contribution margin per ticket. In this trattoria that capped profitable cold-acquisition CAC at $4.86, and the budget came from multiplying that ceiling by the new guests the operation could serve without degrading service.
Does paid advertising work if my restaurant does not retain customers yet?
Does paid advertising work if my restaurant does not retain customers yet?
No, and that is the answer nobody enjoys. Buying traffic against an operation retaining 9% at 60 days means financing one-time visits from people who never return. Fix repeat rate and online reputation first, then buy media. Paytronix (2024) puts monthly retention at the best full-service restaurants at 57.8%; that is the ground where paid advertising multiplies instead of draining.
Should I invest in ads or in producing my own video content for social?
Should I invest in ads or in producing my own video content for social?
Both, with distinct roles and in this order. Owned content builds the asset —the Reels and TikToks here drove 2.4 times more reservations than the best paid ad— and paid advertising distributes it to audiences that already consumed it. Buying media without an owned asset rents expensive, fleeting attention; producing without distributing leaves Tuesday tables empty.
Are paid promotions inside delivery aggregators worth it?
Are paid promotions inside delivery aggregators worth it?
Only for acquisition, never as a repeat engine. Here they added 4.6 points of effective commission and left no owned contact data, so the second order paid full commission again. We kept presence for discovery and moved repeat delivery conversion to the owned channel, which dropped total commission from 8.9% to 4.3% of sales.
Paid advertising: 2026 data from official sources
Verifiable industry benchmarks from official, non-commercial sources (government, industry associations, market research) - not competitors.
| Metric | Value | Source |
|---|---|---|
| Restaurant brochures: examples and design — share of U.S. diners who prefer menus with pictures of food over menus without images (2023) | 72 % (2023) | US Foods — New Survey Reveals Menu and Ordering Choices of Americans (2023) |
| Restaurant brochures: examples and design — share of Americans who review the menu before going to a restaurant (September 2023) | 83 % (2023) | US Foods — New Survey Reveals Menu and Ordering Choices of Americans (2023) |
| Restaurant brochures: examples and design — share of U.S. diners who prefer print menus over QR codes (April 2024 survey, 1,005 respondents) | 90 % (2024) | US Foods — 2024 Survey Reveals Evolution of American Dining Out Habits (2024) |
| Restaurant brochures: examples and design — share of U.S. consumers who said they used more discounts or value promotions than usual (Quarterly Consumer Insights Survey, Q3 2026) | 40 % (T3 2026) | National Restaurant Association — Quarterly Consumer Insights Survey (2026) |
| Restaurant brochures: examples and design — share of U.S. consumers who read direct mail immediately or the same day it arrives (2025 consumer survey) | 84 % (2025) | Lob — 2025 State of Direct Mail Consumer Insights Report (2025) |
| Share of U.S. adults who use Instagram, a working channel for restaurant marketing agencies (2025) | 50 % (2025) | Pew Research Center — Americans' Social Media Use 2025 (2025) |
Related content
Paid advertising: repeat this case in your restaurant
Applied in +8.400 restaurants across 43 countries.